A comparison of Porter’s factors toward NCA; the LPRM’s recommended applications of its mine-site-level-generated data and Behre Dolbear’s identified most important factors to attract country-level and firm-level mining FDI, provide the lens for this case-study (MSV; Porter M, The Competitive Advantage of Nations).

While each mentioned source provides a set of factors or recommendations, respectively, broader than the scope of this analysis, there is clear alignment between, to the factors which are priority, as weighted between the three sources: infrastructure, human resources, development of supporting industries, firm strategy and rivalry, and government.

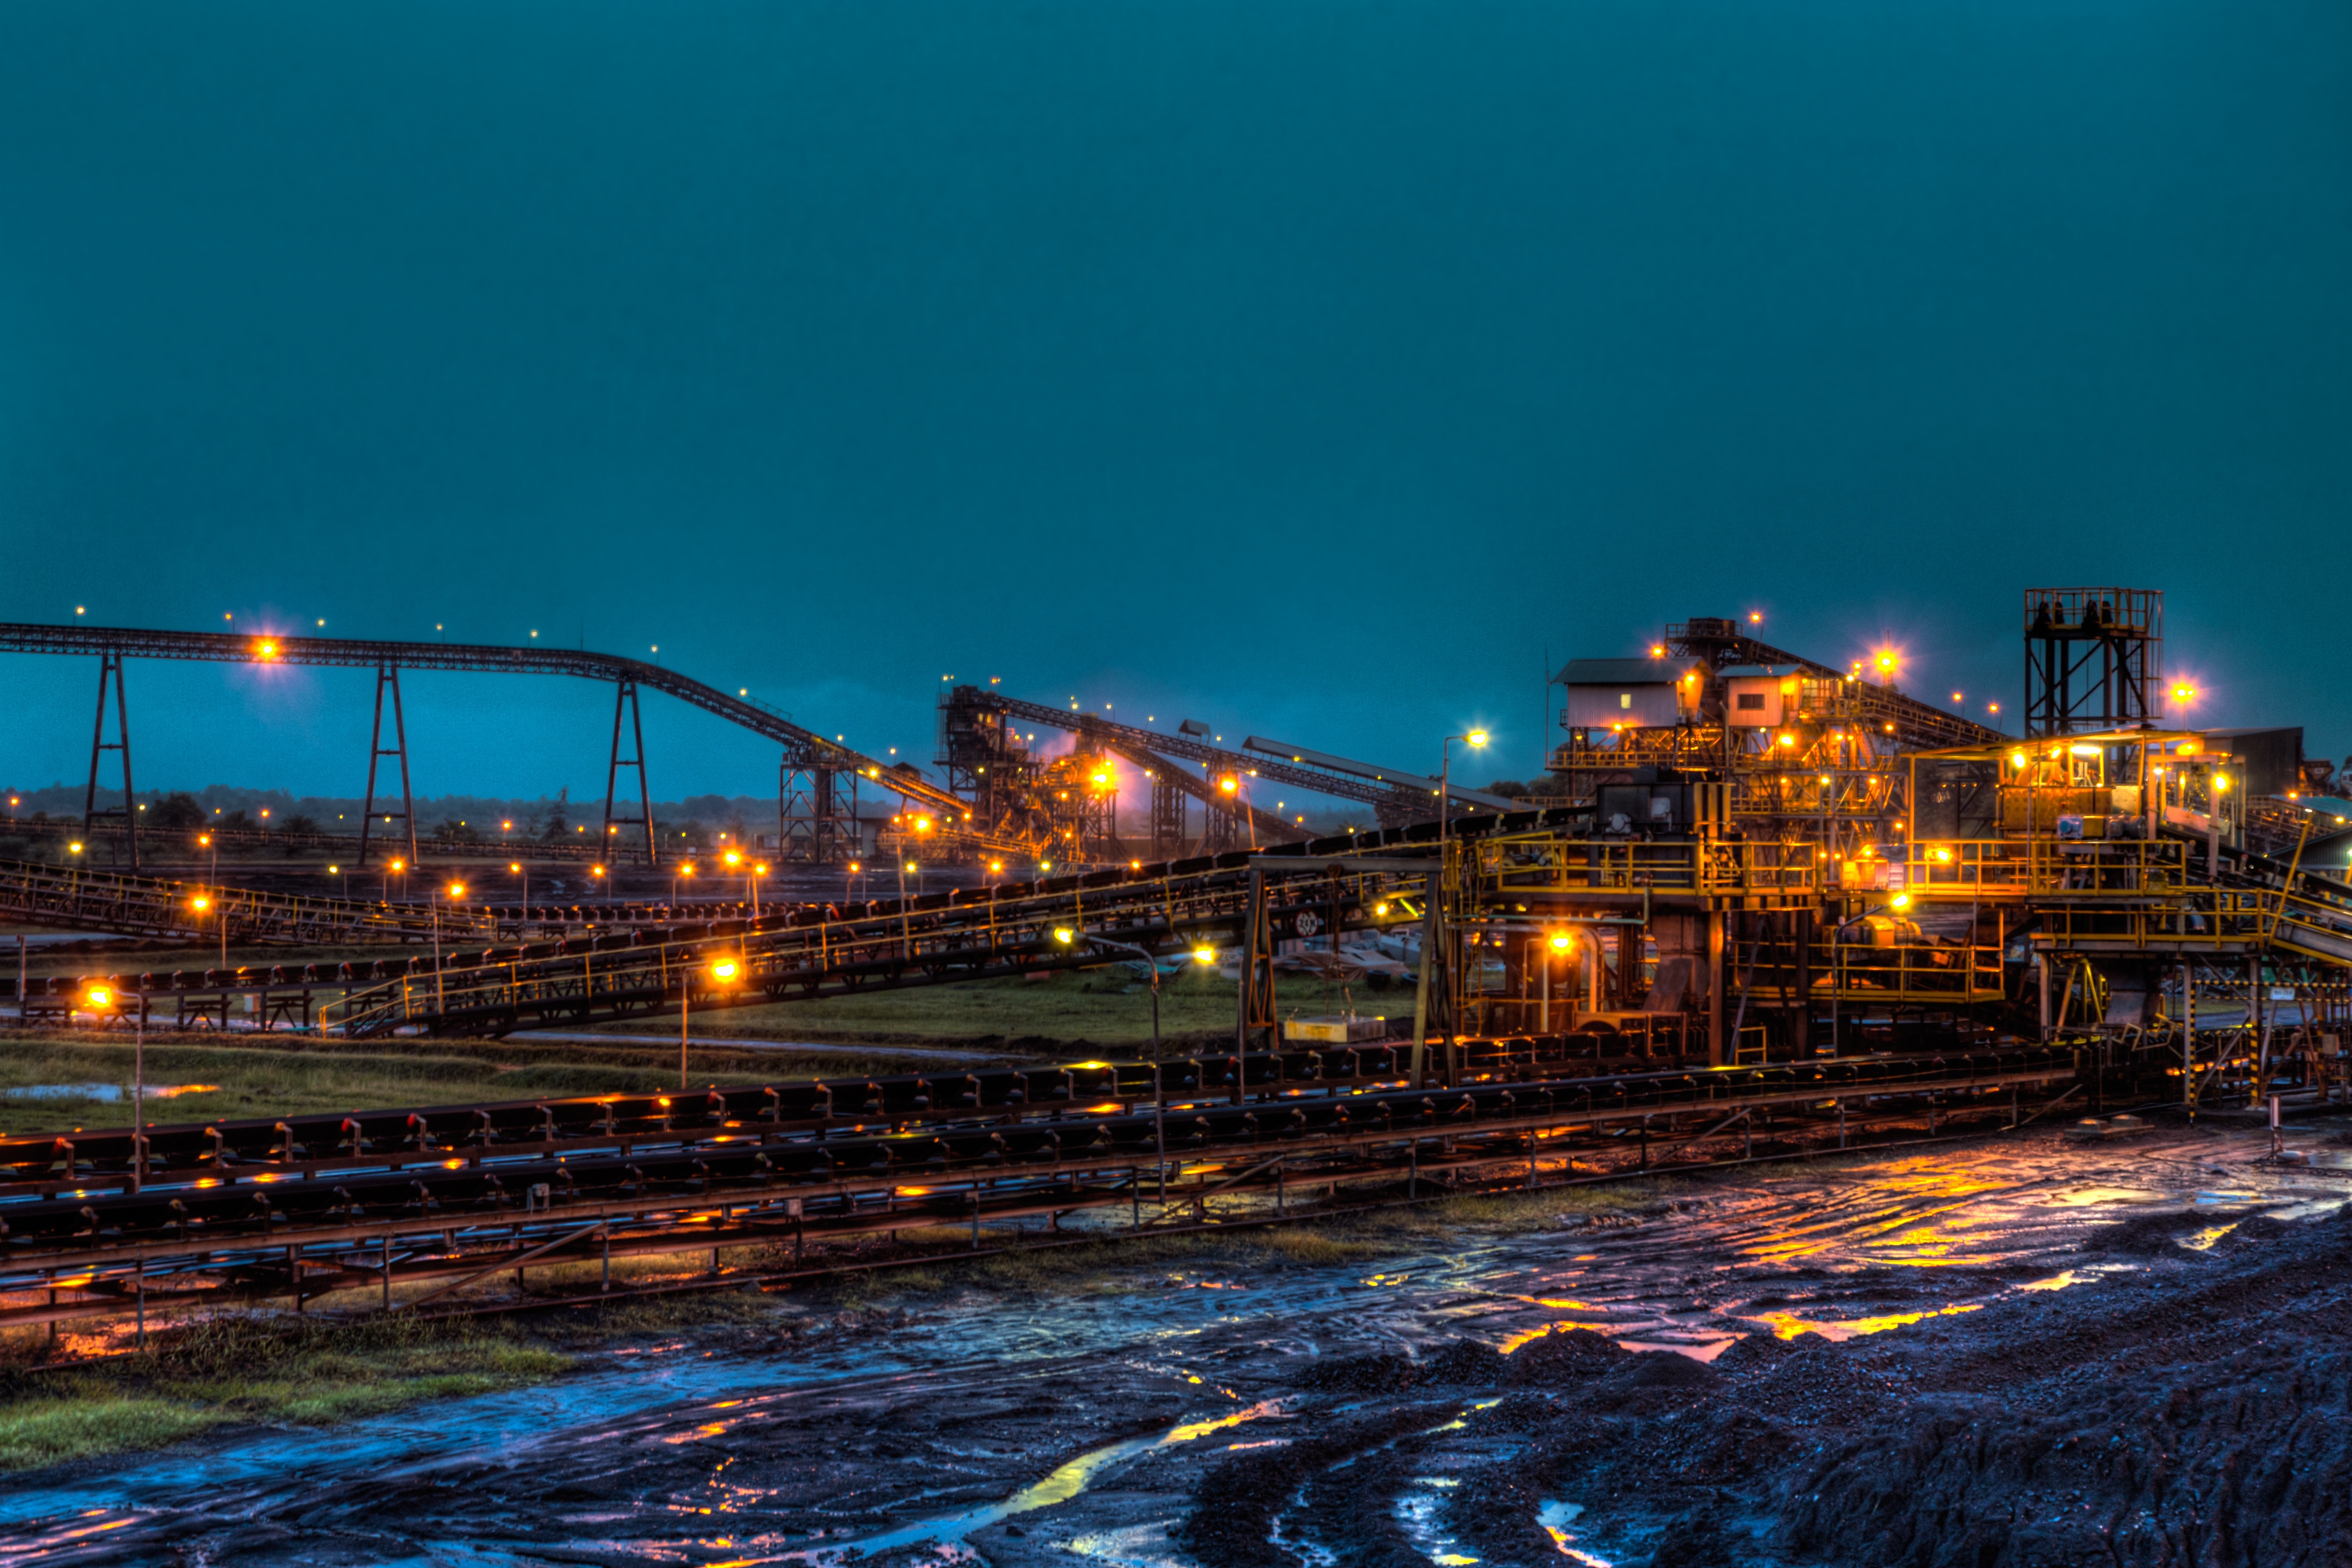
Both Porter and Behre Dolbear highlight efficient infrastructure as a key factor toward developing or maintaining, investment-driven competitive advantage and FDI respectively. Infrastructure is a clear bottle-neck to efficiency in Brazil and insufficient to develop investment-driven NCA.

Brazil’s “investment in infrastructure has fallen from 5.4% of GDP in the 1970s to 2.1% in 2000s.” Transport “infrastructure as a share of GDP has fallen from 2% in the 1970s to 0.5% in the 2000s” and “14% of its roads are paved and rail links remain limited”(Korinek J, 2014).

Local Content Policies in Minerals-exporting countries generated mine-site level data enables host governments to “target infrastructure spending to facilitate more competitive suppliers” ((Geipel J, Nickerson E, Kietly J, Regenstrief T, 2017). This may involve “building new transportation links where shipping costs are preventing competitive prices from suppliers” and therefore inhibiting a flow of FDI into supporting industries.

In the case of Finland, investment-driven FDI is supported by government, notably through an “agreement between mining firms and government for the support of infrastructure development, once parties agree on investments and production levels are realized.”

#sustainability #corporateresponsibility #ESG #mining #internationaldevelopment #wbs #bradfordturner #toronto #socialinnovation #michaelporter

According to a study by the Ontario Not-for-Profit Network, “most technical requirements of non-for-profit organizations in Ontario are outsourced.” The study presents evidence that this suggests a fundamental and systemic issue, impeding the participation of many organizations, in digital transformation, given what will be the requirement of the “centrality of technology to many organizations” (ONN, 2019). Outsourcing does little to build internal capacity or to create a culture of digitally skilled Third-Sector employees. The report from the ONN further purports that “government investment” in nonprofit collaboration addressing “the digital skills gap in the sector must start with strategic investment (ONN, 2019).

Imagine Canada’s 2006 Report on The Sector, writes that “particularly when considering how we structure our internal teams and work with partner organizations, is an important piece and a step in the right direction.” But “it’s not enough: what is needed is recognition within the sector that investing in digital skills training is an investment in ourselves and the future of the sector.” As Imagine Canada’s Bruce MacDonald noted last year, “Effective administration enables fundraising, infrastructure and staffing that are essential to fulfilling a charity’s mission. Real impact requires real investment” (Imagine Canada, 2006). Overall, this body of literature revealed that Ontario’s Third Sector is experiencing a broad spectrum of technology challenges that require a response.

The Sector Inc’s overall approach of this research project was to test the dissertation’s hypothesis against the findings gleaned from the empirical research, triangulated with the evidence in the reviewed literature.

From preliminary discussions with experts and a review of the literature, it’s apparent that consensus exists that:

1. In divesting itself from service delivery as it’s core business and investing in it’s own “transformation,” The Government of Ontario has created a fragmented, strained, “Third Sector” of service-delivery organizations, who’s operational inability to participate in digital transformation, now hinder the effectiveness of the very transformation, which government is undertaking.

2. The digital transformation of government, to improve its capacity to enable Third Sector organizations effectiveness, will not improve outcomes, without Third Sector organizations undergoing digital transformation as well.

3. The Big Four do not see government transformation outside of digital transformation, as one of their core business areas; they do not see government transformation without digital transformation at all.

Simply put, this approach asks the question: what would the critical success factors to successful consulting engagements be?

#socialinnovation #digitaltransformation #government #ops #wbs #toronto #impactinvesting #consulting #nonprofit #corporatesocialresponsibility

Data from Statistics Canada’s 2006 “Report on the Volunteer & Charitable Sector,” shows that of the organizations which fall within the standard distribution of the annual revenue of Ontario’s volunteer and charitable organizations (i.e. the Third Sector), 54% have annual revenues under $100,000; 35% between $100,000 to $1,000,000 and 11% over $1,000,000.

The organizations which fall under the “small” and “medium” classifications above, represent the Third Sector. Within the non-profit sector in Ontario, there are approximately 70,000 of these organizations.

These organizations are non-profit organizations and generally seek to spend 80% of revenue on programming and 20% on administration and fundraising. While at times the procurement of management consulting services could fall within programmatic spend, it is most likely found in the administration sections of the operating budgets making only 20% of the total revenue figures stated available for the purchase of management consulting services.

A review of 100 consulting services contracts revealed the ranges of deal-size for contracts awarded to The Big Four are:

1. Small: $50,000 to $149,999 36%

2. Medium: $150,000 to $2,999,999 46%

3. Large: $3,000,000 and up 18%

The average range of an engagement overall was $2,100,000, making these services for the most part, well out the range of purchase for the Third Sector.

From the evidence, it becomes clear that finding economic efficiencies in social services, which will yield a return on the investment already made in the digital transformation of Government, is a natural evolution of the relations between Government and the Third Sector. And as stated, the assumption is made that the lead agent of this change is a “digital transformation and that this will require involvement of consultants. As there is a limited provincial budget, the consultant fees will have to be found via a reallocation of funding.

#MBA #socialinnovation #consulting #digital #government #wbs #bradfordturner #impactinvesting #nonprofit #toronto #thirdsector #impact #policy #socialfinance

We believe that organizations can achieve more positive change through continuous learning from impact data. That is why we work with Sinzer’s methodologies and tools to guide our customers step by step with a pragmatic and tailor-made impact management approach that suits their needs. We help organizations understand and maximize their positive impact and reduce their negative impact based on insights from data. Our team is dedicated to continuously support our clients to implement the best strategies and methods to improve their impact.

Impact Strategy

We help clients to tackle social challenges. A ‘Theory of Change (ToC)’ provides insight into how change happens. We assist organizations in developing a ToC and to create an Impact Road Map so that they can align their operational activities with their impact ambitions.

Data collection

Our consultants have extensive experience with research and data analysis and use both qualitative and quantitative research methods. We support clients in developing a monitoring- and data collection plan and provide advice in setting up a workable, simple data collection system.

Analysis and reporting

The Sector leverages Sinzer’s specialized in data analysis and impact reporting for small projects, long-term and complex programs and for entire organizations. Sinzer has been pioneers in the field of impact measurement and management since 2008. Both our teams draw from extensive experience with different types of data analysis and is up to date with the latest knowledge of research methods and reporting standards.

Impact Maximization

Data can offer all sorts of new insights. We help clients to make sense of their data and show how these insights can contribute to more positive impact. To enable continuous improvement, we support clients in setting up simple and manageable data collection systems that facilitate learning. Lastly we provide advice on how to convert this learning into concrete actions. This way your organization can have even more positive impact on society.

Management consulting firms are in businesses to make a profit. For firms to provide digital capacity-building services to the Third Sector, it must be commercially viable which currently it is not. Third Sector organizations (with few exceptions) cannot raise investment capital or generate profit-margins from developing economies-of-scale in market-competitive product offerings; and unlike the government, they cannot levy taxes on the population to be invested in the growth of the organization. In short, Third Sector organizations do not have the available working-capital to match the price-points of Big Four service offerings (which here, have been analyzed from available consulting services contracts of The Big Four) (presented later in detail) (Supply Chain Ontario, 2019).

Context Behind the Hypothesis: Government Spending (A Market Analysis)

There are several, interdependent, markets which required definition, in order to properly test the hypothesis: the market for social services in Ontario; the market for consulting services to government; the market for consulting services to the Third-Sector.

Government Spending on Transfer Payments: The Market for Social Services

Ernst & Young’s 2018 report Managing Transformation A Modernization Action Plan for Ontario, classifies the non-profit sector into sub-sectors – the grouping representing the Third Sector being labelled the “Community and Social Services Sector” (Ernst &Young, 2019). Analysis of transfer payments received by this sub-sector, serves to illustrative the size in monetary terms and the nature of the transactions which define the market for social services.

The Ontario Government provides “transfer payments to recipients external to government to fund activities that benefit the public and are designed to achieve public policy objectives” (Government of Ontario, Open Government, 2019). Currently transfer payments from the provincial government to Third Sector organizations, make-up approximately 73% of the sector’s revenue (Imagine Canada, 2006).

Total government expenditure for a fifteen year period has grown from $95B to $144B in real terms; transfer payments grew by $46.3B (CAGR of 3.4%), interest on debt grew by $2.4B (CAGR of 1.4%), and direct OPS expenditures grew by $0.1B (CAGR of 0.0%) (Ernst & Young, 2018).

Government spends a very significant amount on transfer payments but nearly all of this funding is allocated toward “core” operations with little to no room for strategic investment in innovation and efficiency i.e. digital transformation. Ontario faces a series of deficits which have occurred grown in correlation to the growth of the Third-Sector. Both Ernst & Young, the Auditor General, C.D. Howe Institute, The Mowat Centre, and more, agree that sustainable government spending lies in reform of “the delivery of public services that not only contribute to deficit elimination, but are also desirable in their own right.” (Commission on the Reform of Ontario’s Public services, 2012).

In the next post, we will provide a view of the major sectors and breakdown of each sector spent directly by the OPS and through transfer payments.